Table of Contents
Stockmarket 2
| Company | Meridiam Software |
|---|---|
| Distributor | Meridiam Software |
| Year | 1990 |
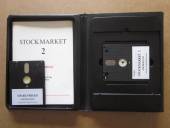
| Packaging | Black hard plastic case 22.30×17.50×2.00 |
| Compatibility | PCW 8256 - PCW 8512 - PCW 9512 |
| Peripherals | Keyboard |
| Load | CP/M+ |
| Gender | Financial analysis |
| Language | English |
| Price | England: £39.95 |
| State | Preserved |
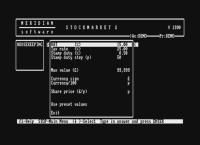
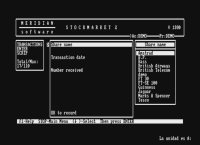
Screenshots
Description
Sharing the financial fortune.
For years, financial experts have been using computers to help them decide when to buy and sell stocks and maintain their stock portfolio (The Stock Market). Meridian Software brings us this program that puts the power back in the hands of small investors.
Stockmarket is a stock analysis program. In its day, its first version was a surprise to APC editors, who, at the time, praised it for its ease of use and flexibility. Meridian Software brings this new version of the program, faster, with more menus and a much improved manual.
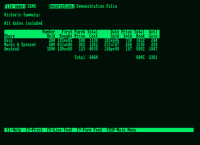
And, a very nice touch, it comes with a realistic, almost up to date, portfolio view of stock prices. So we can start working on the stock market as soon as the packaging is removed.
Stockmarket 2 is certainly aimed at the small investor who wants to track a good number of stocks, plan price changes and keep track of bank balances. It is capable of running on any version of PCW, although those with a dual drive machine can use the second drive to store additional data.
The program is divided into two modules (one on each side of the disc): Prices and Accounts. But in reality this division does not matter, you are not really aware of the two programs, since both work in exactly the same way, with the same degree of use.
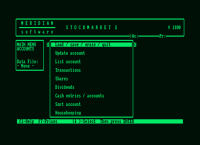
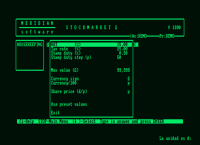
All operations are menu driven, with the main options found within a window in the center of the screen. A smaller box on the left presents the possible options. As you scroll through the options in a menu, the available options appear sequentially on the right side of the menu box by pressing the cursor left key.
So, for example, suppose you want to update some of the stock prices. When asked to provide the company name you can enter from the keyboard or hold down the left cursor key until the correct name appears. This makes it very simple.
Tracing prices
First of all the limitations: Although there is no restriction as to the number of shares you can hold in your portfolio, subject to disk space, you are limited to 260 entries per share. This may not seem like a large number. However, when it is remembered that five years worth of weekly prices of a stock are represented, the constraint does not seem too great.
Selection of the prices module, which is presented with a main menu of six options (in addition to save and exit). Clearly, they are divided into functional pairs: The first two try to enter information, then list the data in some way, then put the operations in order.
As you add a new file to your stock portfolio you need to tell Stockmarket 2 all about it, its name and how the program should treat prices. This last point is very important. While most stock prices are quoted in pence, from time to time some will have half pence tagged on. Cells are quoted to two decimal places, whereas if you play forex you will need to record three figures after the decimal point. There are stock exchange programs that do not allow this flexibility. There is no doubt that Stockmarket 2 is definitely an advantage.
Entering and modifying actual prices is done via option 1. Here is the last date the share prices were entered, followed by a list of our shares and the prices entered on that date. If you change the date from a previous one, the prices entered on that date are displayed. Changing it for a new one means introducing new prices.
Remember the magic number of 260? This refers to the number of different dates that can be stored. When adding another date on 260, the first associated prices are eliminated by the new ones. Option 3 simply allows us to list stock prices, either on the screen or on the printer.
Option 4 is the one that provides the main information necessary for the chartist to flourish. This represents prices in a variety of ways.
The first decision to make is whether to present your prices on a linear or logarithmic scale. The linear scale is easier to understand, but more difficult to interpret. For a chartist who is not the actual share price, your change is important.
A logarithmic scale illustrates this change best, from an equal distance up the vertical scale represents an equal amount of change. For example, if the price moves up half an inch in one week, and then moves up a quarter of an inch over the next week, the rate of change has decreased by 50%.
Once you have solved this dubious question, the program will plot the prices for you in an extremely neat chart. And you can also plot a movement of an average through a series of dates that we determine.
Once again, it is in this last option where the chartist would be placed in the market. Averaging over thirteen weeks, for example, provides a clearer view of how price swings, with the normal ups and downs of outrageous fortune, smooth out. It is this type of plot that will help you make the decision to buy or sell: Buy if the curve moves up, sell as soon as it starts to move down. An average of five weeks, not less, gives us the signal to buy or sell earlier.
So the prudent chartist would pick something like 13 weeks. The more aggressive trader is likely to gamble it all on the five-week change.
An additional refinement: Logically, when plotting an average, the most sensible thing is to plot the prices on the central date to calculate the average in that period. But in practice, it is often more convenient to plot it last, because on an average basis a plot will stop before the final date. Stockmarket 2 offers both options, and also allows us to overlap as many parcels as we wish.
There are two cleaning options. First, we can adjust the prices by lowering the price by creating more shares and gifting them to the owners of the current shares. This is called a released extension. For example, say that a price per share rises to 500p, and the directors of the companies feel that it would be better at 100p. By creating five times the number of shares, and giving the extra shares to existing shareholders on a four-for-one fee basis, the share price will be reduced accordingly.
This type of price decline must be recorded in the stock price history, otherwise the future price plot will indicate an unrealistic decline.
Another type of adjustment occurs when a company wants to raise more cash. In this case a question of rights will be issued. The additional shares are created and the shareholders will have the right to buy them back on a proportional basis, at a cheaper price than the current price. Once again, this means that the share price will fall. But this time it is a real price drop.
Some actions (such as many of the privatized issues) are sold only a paid part, we pay a part now and the other part later. Stockmarket 2 allows this information to be entered and prices are automatically adjusted when the second and subsequent payments are due.
Finally, if we do not agree on the price adjustment, either for the scrip or procedural rights, you just have to multiply all the prices before a certain date by a fixed value.
Accounting procedures
The accounts module of this program is as flexible and as useful as the prices. If you use this part correctly, prices in tandem with the module, we will be able to keep track of what has happened to our money, both for our own peace of mind and for the collector. Let's not forget the tax collector!
The first option, updating accounts, acts in the same way as the option to edit prices within the prices module. We are represented with a list of the shares in our portfolio and the last date entered. We have to enter a new date and new data. On this occasion, of course, there is no limit of 260 dates, as far as accounting is concerned, it is only the last date that is important.
It is an annoying blow, however, to have to re-enter share prices a second time. With some thought, it should have been possible to take the input stock price data and incorporate it into the accounts.
Within this option, you can also enter the current yields and E/P ratios that refer to our shares. This data can be obtained from the financial press and gives a good idea of how well we are doing. But we don't have to enter this data if we don't want to. They are automatically recalculated every time prices are changed.
Having entered the latest quotes, we can print an extremely tidy account of our portfolio, in a way that impresses anyone. The listing can be in terms of current price, or as a historical record of ticket prices. You can make a note of all the recorded dates, or you can define a period during which the account will be calculated.
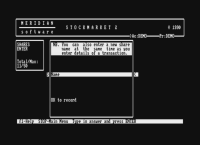
The next two options within the Accounts Menu refer to relationships: Buy, Sell, and Dividends. In the easiest way, we have come to expect from this program all transactions that can be recorded, with features such as costs that are automatically calculated if we wish. Relevant parameters, such as VAT rates, are recorded separately and can be changed within the cleanup module.
Thus, when we enter the purchase on the screen, we can indicate the number of shares that we have bought and their price, and the program will show the rest of the parameters (tax, commission and VAT). Or we can enter the price of the share and the total cost that we are willing to spend. The program then tells us how many shares can be purchased, along with the charges.
For both buying and selling, two holdings can be combined together.
Finally, a record of financial flows can be kept through the cash transactions module. Up to four different cash accounts (bank, building society, or whatever) can be maintained.
In summary
For the sake of brevity, breaking down a number of features makes Stockmarket a very useful program that is friendly and easy to use. There are facilities, for example, to change the default drives, and to alter the characters that appear on the screen. The entire program appears to have been well thought out and designed with the small investor in mind. It does not contain all the bells and whistles of the demanding chartist, such as stop loss lines, regression analysis, sector weights and so on. But then relatively few people will want all of this.
For most, it is enough to be able to plot changes in stock prices over time, in order to get an idea of how the stock is performing.
Any PCW owner who wants to get started on the stock market should get Stockmarket 2. It's made for us, and it could help avoid future effects.
Packing
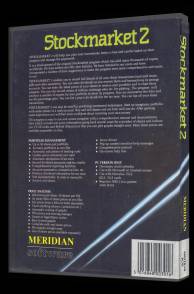
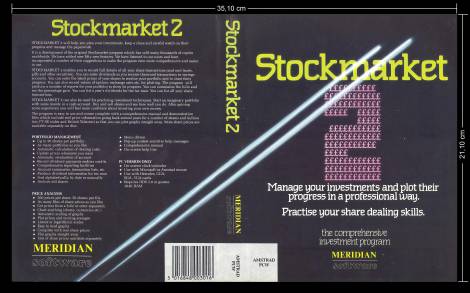
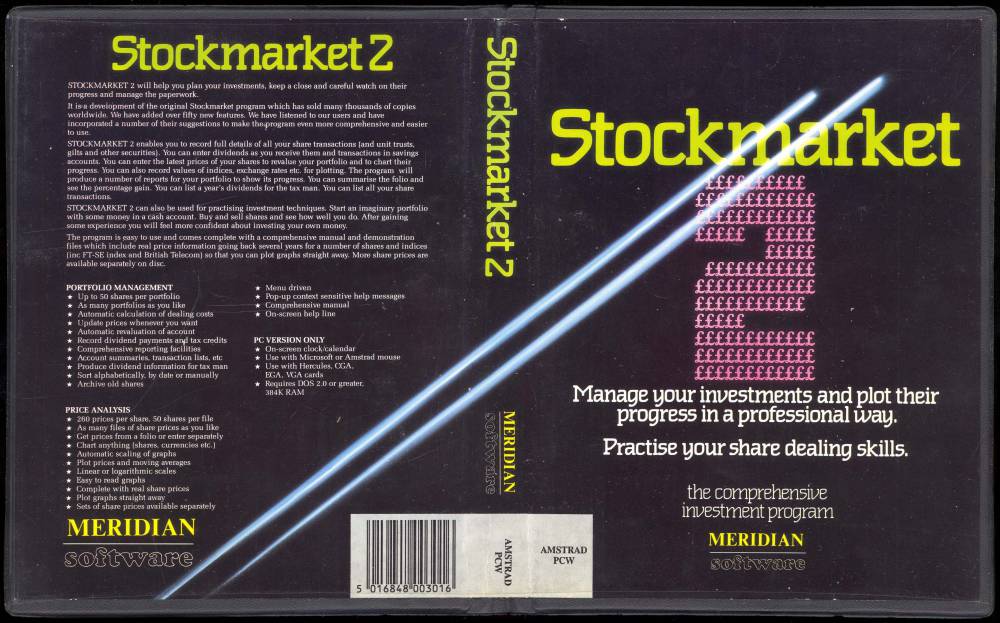
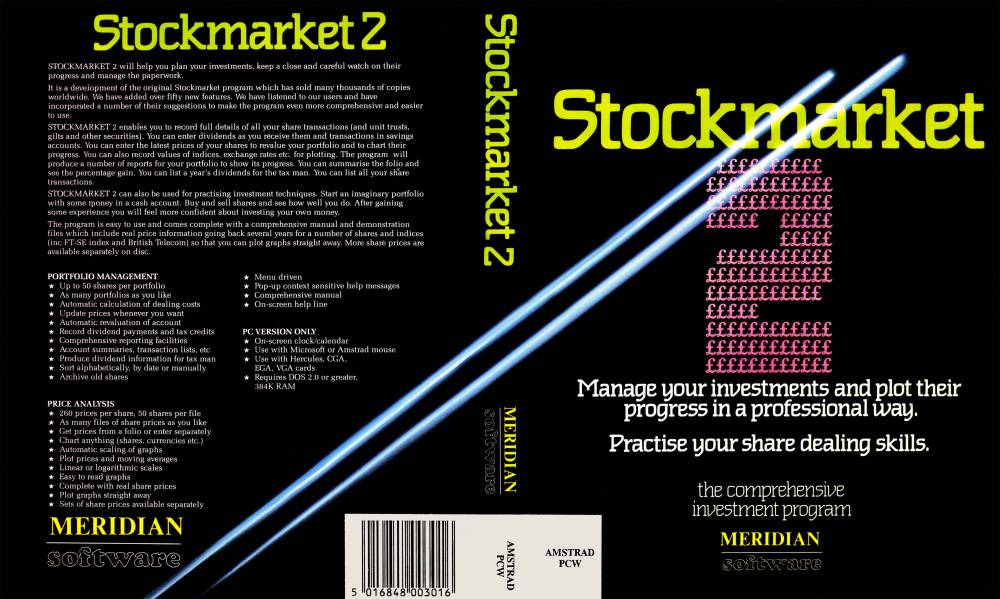
Cover
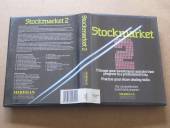
- Here you have the original cover.
- Here you have the restored cover.
Actual measurement of the cover: Width: 35.20 cm x Height: 21.10 cm
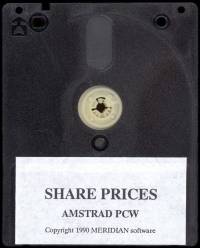
Disk
Labels
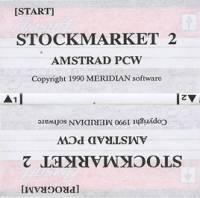
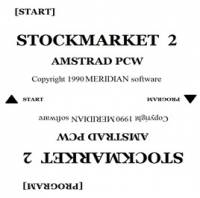
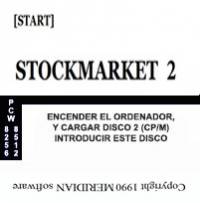
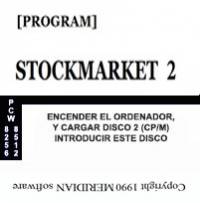
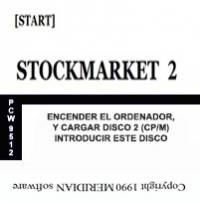
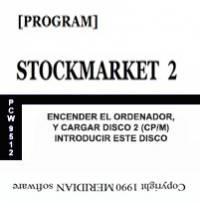
Custom labels to print. Over the years due to their use, the labels are damaged and lose their color and quality. Now we try to adapt the most similar to the extent of our possibilities, the labels so that they can be printed and replaced or for those of you who work with a copy of the program and preserve the original disc. Measurement in 3“ height: 7.00 cm - width: 7.10 cm. The first image corresponds to the original game label, the second is the same modified label to replace the broken one and the third and fourth images are for 3.5“ discs.
Extras
Coming soon
Download
Program
The disc images, have been obtained from the original version of Stockmarket 2, have been recorded and verified.
- Stockmarket 2 Program (Compressed .DSK file in ZIP format)
- Stockmarket 2 Share Prices (Compressed .DSK file in ZIP format)
Manual
Below you can download the Stockmarket 2 program manual or view it online. The manual sheet measures: Width 14.10 cm x Height 19.00 cm.
- Stockmarket 2 Manual (PDF File)

